Tuesday 24 September 2019

Historical Elite Level Attendance Figures : Sheffield Eagles


How does being at the top level of a sport affect attendance figures compared to when relegated to a lower division? I thought I'd look at that with regard to the Sheffield Eagles club. It's situated in South Yorkshire, not a traditional RL area. Of course, it is a city known for steel and particularly stainless steel. The present population is nearly 600,000.

As for the RL club, it was founded in 1984 so one of the new North English clubs. Despite its short history, it has managed a famous Challenge Cup victory (1988) against a fine Wigan side.


Pre-Super League
Super League

89-90 4,038 11/14
1996 4,704 7/12

90-91 4,033 13/14
1997 4,413 8/12

92-93 3,069 10/16
1998 4,641 8/12

93-94 2,980 6/16
1999 3,540 10/14

94-95 2,662 8/14


95-96 3,106 5/11
SL Average 4,325


Pre SL Average 3,315


Combined 4,168

The 1980-81 and 1981-82 top flight presence (shaded yellow) was ended for a season, followed by eight consecutive seasons in the top division (salmon). The club was then 'persuaded' to merge with Huddersfield for the year 2000 but it didn't work and the club returned to its former name.

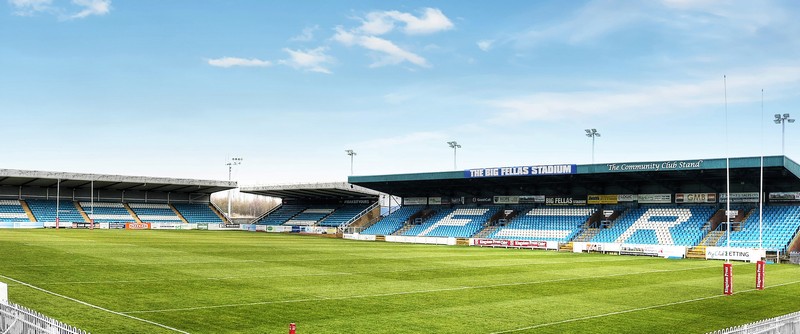
For a soccer mad city, getting RL going and keeping it going has been a challenge. In recent times, having an acceptable field to play on in Sheffield has been an issue, one hopefully now resolved (see pic above) with a new stand coming (see pic below).

Please note the Pre-SL Average above includes only the figures shown above from 1980-81 to 95-96. The attendance numbers below are some way down from the time at the top, but with all they have been through, the club is only here today because people believed in it and showed plenty of steely resolve.

Sheffield 2012 2013 2014 2015 2016 2017 2018 2019
Championship 1,178 1,012 ? 1,249 627 583 684 944

Historical Elite Level Attendance Figures : Oldham RLFC


How does being at the top level of a sport affect attendance figures compared to when relegated to a lower division? I thought I'd look at that with data I have, now looking at the Olham RLFC club. It's situated in the Greater Manchester (historically Lancashire) and was particularly known for its textile manufacturing from the late 19th century. Apparently it was once the most productive cotton producing town in the world, producing more cotton than Germany and France combined. Wow! The present population is around 95,000.

As for the RL club, it is one of the 22 founding clubs that formed in 1895. They have won the Challenge Cup three times (1899, 1925 & 1927) and been League Champions on four occasions (1905, 1910, 1911 & 1957). They also won the now defunct Lancashire Cup nine times. Collectively That's quite an achievement, although nothing in recent times.


Pre-Super League
Super League

80-81 3,220 16/16
1996 3,629 8/12

82-83 3,721 8/16
1997 3,832 12/12

83-84 3,641 10/16


84-85 4,562 5/16
SL Average 3,731

85-86 4,726 9/16
Pre SL Average 4,247

86-87 4,525 13/16
Combined 4,168

88-89 5,858 12/14


90-91 5,095 12/14


93-94 4,294 13/16


94-95 3,890 10/16


95-96 3,188 8/11


The 1980-81 season (shaded yellow) had them relegated when they came 16th. Another five years of success followed (salmon) but 13th from 16 sides was the end of that run at the top. 1988-89 and 1990-91 were two one year stints in top flight before a five year return. The latter two was in the newly formed Super League, they came 12th and have never returned. They are currently in League 1 (division 3).

Current average attendances are well below the modest first division elite level (see chart below). Financial problems dogged the club after its relegation from SL.

Please note the Pre-SL Average above includes only the figures shown above from 1980-81 to 93-94. In the chart below, yellow is League 1 (division 3) and blue Championship (division 2)

Oldham 2012 2013 2014 2015 2016 2017 2018 2019
Champ/Lge 1 606 689 ? 571 831 774 505 633

Monday 23 September 2019

Historical Elite Level Attendance Figures : Featherstone Rovers


How does being at the top level of a sport affect attendance figures compared to when relegated to a lower division? I thought I'd look at that with data I have, now addressing the Featherstone Rovers club. It's situated in the City of Wakefield (historically Yorkshire) and was particularly known for its coal mining. The present population is only around 15,000.

As for the RL club, it formed in 1902 after the previous RL club only lasted from between 1898 and 1902. They have won the Challenge Cup thrice (1967, 1973 & 1983) and been League Champions once in 1977. For a town this size, amazing.


Pre-Super League
Super League

80-81 3,007 12/16
Nada

81-82 2,805 10/16


82-83 2,647 12/16
SL Average n/a

83-84 2,965 12/16
Pre SL Average 3,439

84-85 2,505 9/16
Combined 3,439

85-86 2,678 13/16


86-87 3,008 14/16


88-89 4,379 6/14


89-90 4,264 10/14


90-91 4,722 8/14


91-92 4,002 13/14


93-94 4,030 11/16


94-95 3,697 11/16


The 1980-81 to 1986-87 top flight presence (shaded yellow) ended when they came 14th out of 16 sides. Another four successful years followed (salmon) but 13th from 14 was the end of that run at the top. A 1993-94 return ended after two seasons, only dropping despite a creditable 11th out of 16 due the introduction of Super League and making way for two new teams.

Since the arrival of Super League, Rovers have never been able to gain entry to the top level of UK RL. Attendances in the division two Championship are not too far removed form the first division elite level (see chart below). Clubs like Featherstone that have a long history of RL often seem to retain more spectators when the club is relegated as opposed to newer ones. Fev is a true RL town.

Please note the Pre-SL Average above includes only the figures shown above from 1980-81 to 94-95.

Featherstone 2012 2013 2014 2015 2016 2017 2018 2019
Championship 2,282 2,496 ? 2,008 2,655 2,624 2,094 2,304

Saturday 21 September 2019

Historical Elite Level Attendance Figures : Leigh Centurions


How does being at the top level of a sport affect attendance figures compared to when relegated to a lower division? I thought I'd look at that with data I have, moving on to the Leigh Centurions club. It's situated in Greater Manchester, historically Lancashire and was particularly known for its cotton industry and coal mining. The population is just over 50,000 in number.

As for the RL club, it is one of the 22 founding clubs that formed in 1895. They have won the Challenge Cup twice (1921 & 1971) and been first division champions the same number of times (1906 & 1982).


Pre-Super League
Super League

80-81 4,498 10/16
2005 4,736 12/12

81-82 5,939 1/16
2017 6,301 11/12

82-83 4,617 10/16


83-84 4,434 11/16
SL Average 5,519

84-85 3,822 14/16
Pre SL Average 4,544

86-87 4,883 10/16
Combined 4,706

87-88 4,516 12/14


89-90 4,634 12/14


92-93 3,802 11/14


93-94 4,292 16/16


The 1980-81 to 1984-85 top flight presence (shaded yellow) ended when came 14th out of 16 sides. Another two year stint followed (salmon) but 12th from 14 sides extinguished that return. A 1989-90 return ended abruptly, then another two years at the top also concluded with a 16th placing.

Super League arrived and for only two seasons have Leigh been involved, neither proving successful on the field although the attendance figure in 2017 was well above any in this period under discussion. Crowds in the Championship in non Super league years are set out below from 2012. Today the club plays at a very nice, modern 12,500 capacity stadium (see pic). Attendances in the division two championship are not too far removed form the first division elite level.

Please note the Pre-SL Average above includes only the figures shown above from 1980-81 to 93-94.

Leigh 2012 2013 2014 2015 2016 2017 2018 2019
Championship 1,772 1,584 ? 3,421 3,545 SL 3,539 3,241

Tuesday 17 September 2019

UK Teams Rated : 2019 Also Rans

Of the twelve clubs in the comp (I know 14 would be much better), seven didn't make the playoffs. They also ran, but not fast enough. So how did they go?

12th. 20 points London Broncos (South England).

Boxed above their weight and were in the hunt until the last round. A fantastic effort, but deservedly the team that should be relegated in terms of performance and quality. If heart was the determining factor...

11th. 20 points Hull KR (Yorkshire).

The team was better than this but they struggled and lost games they should have won toward the end of the season. The very loyal fans deserved better.

10th. 22 points Huddersfield Giants (Yorkshire).

Not a bad side but perhaps short of a bit of quality in key positions. Unless they address that, this season will be repeated in 2020.

9th. 22 points. Wakefield Trinity Wild Cats (Yorkshire).

Some good players but a side that struggled for consistency. Their goal difference shows they were some way better than the three below them, but the points tally didn't reflect that.

8th. 24 points. Leeds Rhinos (Yorkshire).

How the mighty have fallen. A poor coach and a dismal start to the season had people talking of their relegation. A new coach and some better results got them out of trouble. The only side here with a positive points differential.

7th. 26 points. Catalan Dragons (France).

They started the season well and looked to be heading to the playoffs. Then a crash in form and out of contention. The fans are understandably disillusioned with the loss of form in a season that promised much.

6th. 30 points. Hull FC. (Yorkshire).

During the season I was constantly surprised where this team was on the ladder. I had the impression they were scrapping at the lower end of the table but much of the time they were in a playoff spot. The fact that the points difference was less than the 9th placed side says it all for me. A poor effort that didn't deserve a place in the finals.


Rk Team Pts W L Diff

6 Hull FC 30 15 14 -123

7 Catalan Dragons 26 13 16 -192

8 Leeds Rhinos 24 12 17 6

9 Wakefield Trinity 22 11 18 -115

10 Huddersfield Giants 22 11 18 -205

11 Hull KR 20 10 29 -220

12 London Broncos 20 10 19 -282